To determine whether the meditation course successfully enhanced participants executive function capacities in the predicted directions (Hypothesis 4), participants' scores before and after the intervention (at T1 and T2) on the DSB and the IST were analysed.
DSB. Figure 7 represents the mean DSB scores, for each group, at T1 and T2. The meditators demonstrated a highly significant increase over the course of the intervention (t[19] = -3.97, p < .001, d = -.71), while the nonmeditators demonstrated no significant change (t[19] = -.92, p = .91, d = -.02).
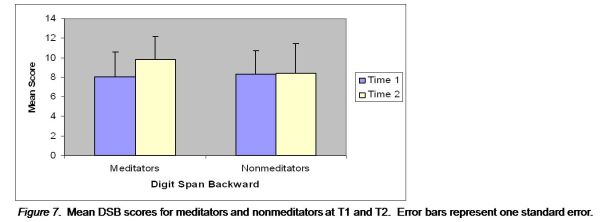
There was a highly significant main effect of time (F[1,38] = 8.75, p = .005, ╬À2 = .19), a nonsignificant main effect of group (F[1,38] = .52, p = .48, ╬À2 = .01), and a highly significant time by group interaction (F[1,38] = 7.81, p = .008, ╬À2 = .17).
IST. One participant was discovered to be a multivariate outlier and removed from the analyses of the IST.
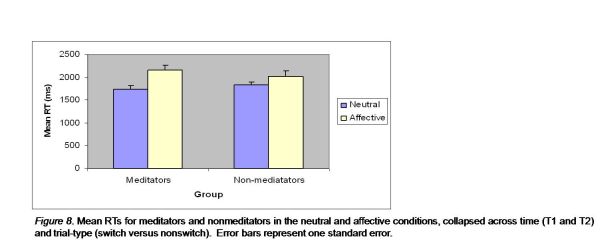
An omnibus ANOVA comparing participants reactions times across time (T1 vs. T2), condition (neutral vs. affective), and trial-type (switch vs. nonswitch), with a between group factors of group (meditators vs. non-meditators), revealed significant main effects of time (F[1,38] = 18.83, p < .001, ╬À2 = .34), condition (F[1,38] = 37.44, p < .001, ╬À2 = .50), trial-type (F[1,38] = 115.82, p < .001, ╬À2 = .76), and significant interaction effects of condition by group (F[1,38] = 4.68, p = .04, ╬À2 = .11), condition by time (F[1,38] = 8.89, p = .005, ╬À2 = .19) and time by group (F[1,38] = 4.80, p = .04, ╬À2 = .11). Table 3 summarises the mean reaction times for each group, on each trial-type, for each condition, at T1 and T2.
Figure 8 represents the group by condition interaction effect (i.e. collapsed across time and trial-type), indicating that the meditators' demonstrated significantly larger RTs in the affective condition, relative to the neutral condition, than did the nonmeditators.
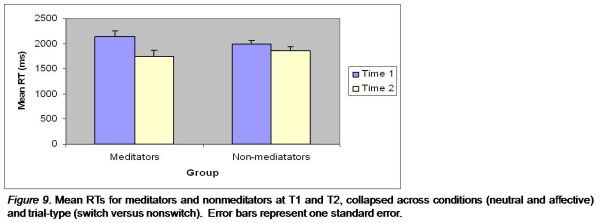
Figure 9 represents the group by time interaction effect (i.e. collapsed across condition and trial-type), indicating that the meditators' overall RTs significantly improved from T1 to T2, whereas the nonmeditators did not.
| Meditators (n = 20) | Nonmeditators (n = 20) | |||
|---|---|---|---|---|
| Measure | Mean | SD | Mean | SD |
| Time 1 | ||||
| Neutral | ||||
| Switch | 2022.12 | 458.64 | 2075.77 | 533.22 |
| Nonswitch | 1750.65 | 423.65 | 1728.65 | 357.27 |
| Affective | ||||
| Switch | 2571.39 | 735.85 | 2316.53 | 651.12 |
| Nonswitch | 2244.92 | 685.15 | 1992.8 | 621.39 |
| Time 2 | ||||
| Neutral | ||||
| Switch | 1717.2 | 383.32 | 1962.18 | 436.76 |
| Nonswitch | 1467.71 | 363.7 | 1618.86 | 301.22 |
| Affective | ||||
| Switch | 2057.84 | 334.32 | 2072.26 | 523.43 |
| Nonswitch | 1756.76 | 359.12 | 1758.75 | 436.8 |